
Figure 7. Biological plausibility.
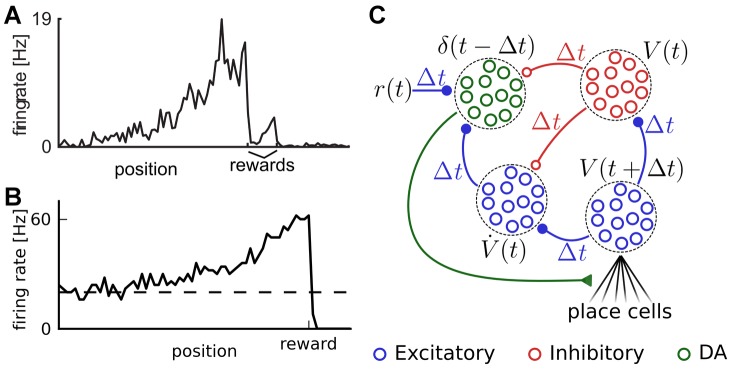
A: Firing rate of rat ventral striatum “ramp cells” during a maze navigation task. In the original experiment, the rat was rewarded in two different places, first by banana flavored food pellets, corresponding to the big drop in activity, then by neutral taste food pellets, corresponding to the end of small ramp. Adapted from van der Meer and Redish [44]. B: Firing rate of a single critic neuron in our model from the linear track task in Figure 2C. The dashed line indicates the firing rate  (Eq. 12) corresponding to
  . C: Putative network to calculate the TD error using synaptic delays. The lower right group of neurons corresponds to the critic neurons we considered in this paper. Each group of neurons gets its input delayed by the amount of the synaptic delay
  . Provided the synapses have the adequate efficacies (not shown), this allows the calculation of
 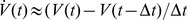 and the TD error
  .
.