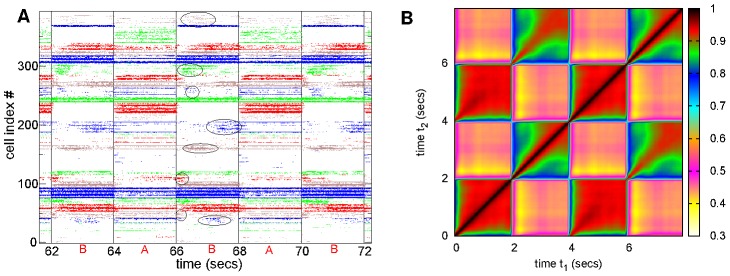
Figure 1. Stimulus onset locked reproducible cell assembly sequences.

Cell raster plot time series segment for the  cell network simulation with connectivity
  , inhibitory neurotransmitter timescale timescale
  msec and synaptic strength parameter
  so that peak synaptic conductance is
  and peak IPSP size
  , corresponding to Figure 8(e,f).
  second input switching stimuli
  and
and  are indicated on bottom axis. Cells are grouped and coloured by k-means clusters with 30 clusters applied to only stimulus
  . All cells active in stimulus
  shown. Elipses indicate cell cluster bursts which appear to repeat across multiple presentations of stimulus
  . (b) 8 second similarity matrix
  averaged across the whole 180–12 second time series, including 42 presentations of each stimulus, a segment of which is shown in (a). Colours shown in key. Stimulus A is presented during periods
  and
and  and stimulus B is presented during periods
  and
and  secs.
secs.
