
Figure 2. Mean firing rate similarity shows peak at same time epoch in the following presentation of current stimulus.
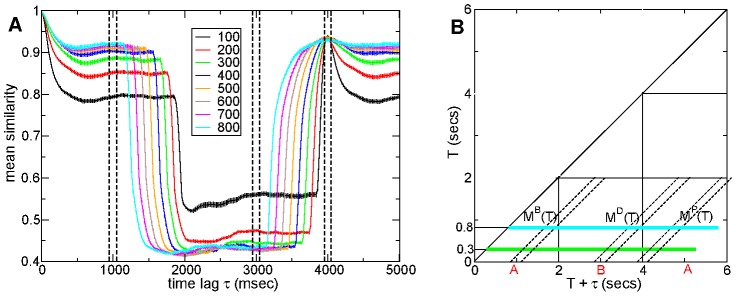
(a) Mean similarity profiles  for connectivity
  network simulation versus time lag
  . Firing rate similarities calculated using 100 msec window incremented in 10 msec steps. Epochs
  after stimulus onset shown in key. Bars indicate sem. Vertical lines indicate averaging periods (see Figure 2(b)). 500 cell network simulation of length 180–12 seconds under a
  second input switching protocol. Inhibitory neurotransmitter timescale
  msec. Synaptic strength
  so that peak synaptic conductance is
 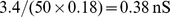 and peak IPSP size
  (b) Illustration of mean similarity profiles
  and calculation of averages
  ,
,  ,
,  . For example the green solid line shows
  while
while  is the mean similarity in the intersection of the green solid line and the two diagonal lines denoted by
  at time lags
  .
.