
Figure 3. Stimulus onset locked reproducible dynamics maximal at striatal connectivity.
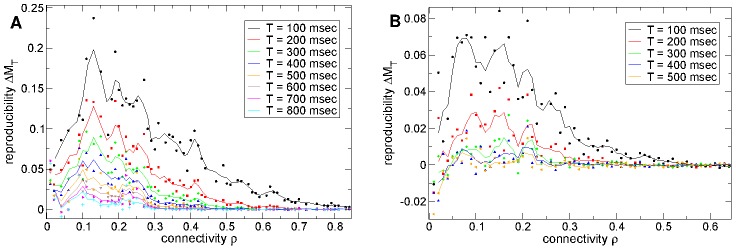
(a) Strength of stimulus onset locked reproducible dynamics  (see text) versus connectivity
  for several different epochs
  after stimulus onset (see key) corresponding to Figure 2(b). Inhibitory neurotransmitter timescale
  msec. Synaptic strength parameter
  so that peak synaptic conductance varies as
  and peak IPSP size as
  . (b) Same as (a) except inhibitory neurotransmitter timescale reduced by
  to
to  msec. Synaptic strength parameter
  so that peak synaptic conductance varies as
  and peak IPSP size as
  . (a,b) 500 cell network simulations of length 180–12 seconds under the
  second input switching protocol. Points show actual values, solid lines show three point average.