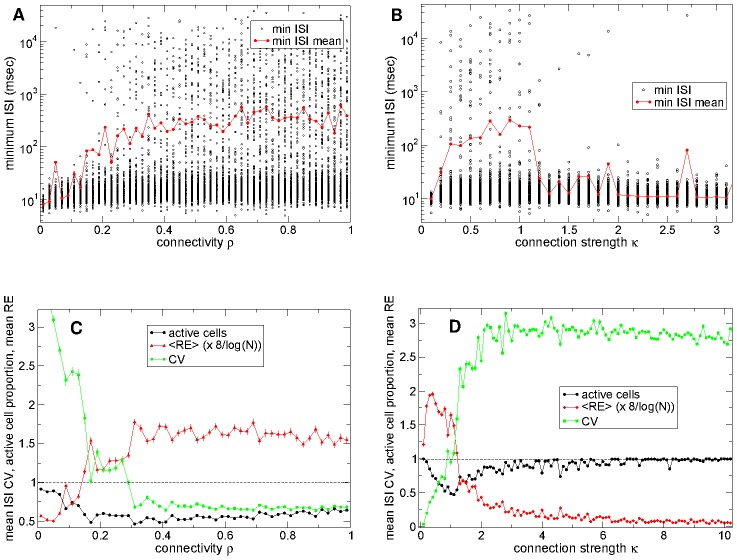
Figure 5. Dynamical regime transition in network activity.
(a) Black circles: minimum observed ISI for each active cell in network simulations of different connectivity. Red line: mean of minimum observed ISI across all cells for each network simulation. Synaptic strength parameter  so that peak synaptic conductance varies as
  and peak IPSP size
  . (b) Same as (a) but versus synaptic strength parameter
  for connectivity
  . Actual peak synaptic conductance is given by
  and
and  generates realistic peak IPSP sizes of around
 . (c) Green line: mean ISI coefficient of variation (CV) across all cells in network simulations of different connectivity corresponding to (a) (bars indicated sem). Black line: proportion of active cells (those that fire at least three spikes in the 168 second time series). Red line: mean relative entropy,
  of 100 msec firing rate distribution across all cells rescaled by
  where
where  is the number of active cells (see text) (bars indicated sem). (d) Same as (c) but corresponding to (b). (a,b,c,d)
  cell network simulations under constant (randomly fluctuating) excitation without stimulus switching. 180–12 second time series. Inhibitory neurotransmitter timescale
  msec.
msec.

