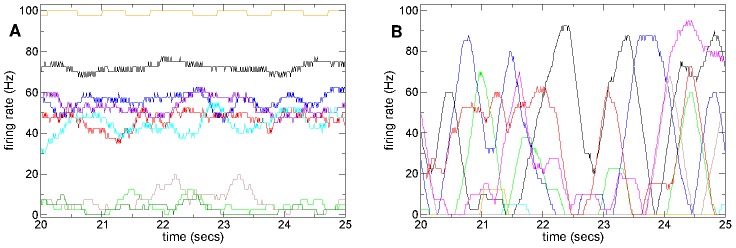
Figure 6. Firing rate time series show qualitatively different behaviours dependent on connectivity.

(a,b) Firing rate time series segments based on 400 msec moving window for several randomly chosen cells from 500 cell network simulations under constant (randomly fluctuating) excitation without stimulus switching. Inhibitory neurotransmitter timescale  msec. (a) Connectivity
  , synaptic strength parameter
  so that peak synaptic conductance is
  and peak IPSP size
  ; (b) Connectivity
  , synaptic strength parameter
  so that peak synaptic conductance is
  and peak IPSP size
  .
.
