
Figure 7. MSN network rate dynamics is marginally stable at striatally relevant connectivity and connection strength.
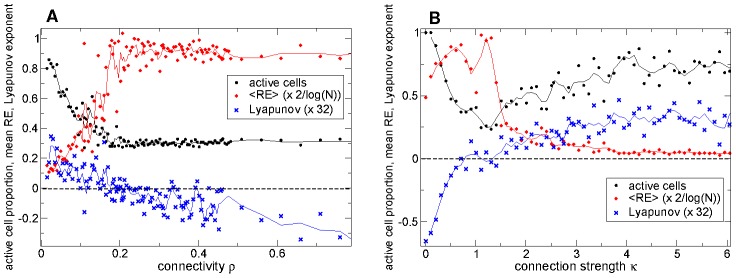
(a,b) Black circles : proportion of active cells. Red diamonds : mean relative entropy  rescaled by
  where
where  is the number of active cells. Blue crosses : maximal Lyapunov exponent rescaled by 32. Solid lines show three point averages. (a) Variation in connectivity
  for many simulations. Synaptic strength parameter
  so that peak synaptic conductance varies as
  and peak IPSP size as
  (b) Variation in connection strength
  for many simulations of connectivity
  . Actual peak conductance is given by
  and
and  generates realistic peak IPSP sizes of around
 . (a,b)
  cell deterministic reduced rate network simulations (see main text) of length 110 secs. Initial 100 secs discarded from analysis. Inhibitory neurotransmitter timescale
  msec.
msec.