
Figure 8. Population component dynamics shows strong stimulus interaction at intermediate connectivity.

(a,c,e) PSTH for several principal components (see key) locked to stimulus onset in the  second input switching protocol calculated from 180–12 second time series including 42 presentations of each of the two stimuli. 500 cell network simulations. Synaptic strength parameter
  . Inhibitory neurotransmitter timescale
  msec. (b,d,f) PSD of components corresponding to (a,c,e) in log-log axes. (a,b) High connectivity
  , so that peak synaptic conductance is
 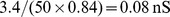 and peak IPSP size
  ; (c,d) low connectivity
  , so that peak synaptic conductance is
  and peak IPSP size
  ; (e,f) intermediate connectivity
  , so that peak synaptic conductance is
  and peak IPSP size
  .
.