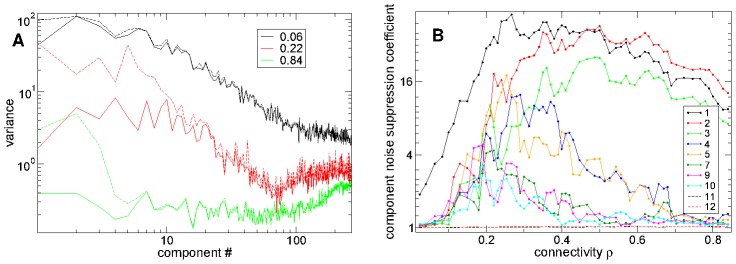
Figure 9. Ratio of signal to noise variance maximal at striatal connectivity in first 10 principal population components.

(a) Component PSTH variance (dashed) and noise variance (solid) versus component number for three simulations of different connectivity  (see key) corresponding to Figure 8 with the same parameters. (b) Ratio of signal variance to noise variance for several components (see key) versus connectivity
  . Peak synaptic conductance varies as
  and peak IPSP size as
  . (a,b) 500 cell network simulations of 168 seconds under
  second input switching. Synaptic strength
  . Inhibitory neurotransmitter timescale
  msec.
msec.
