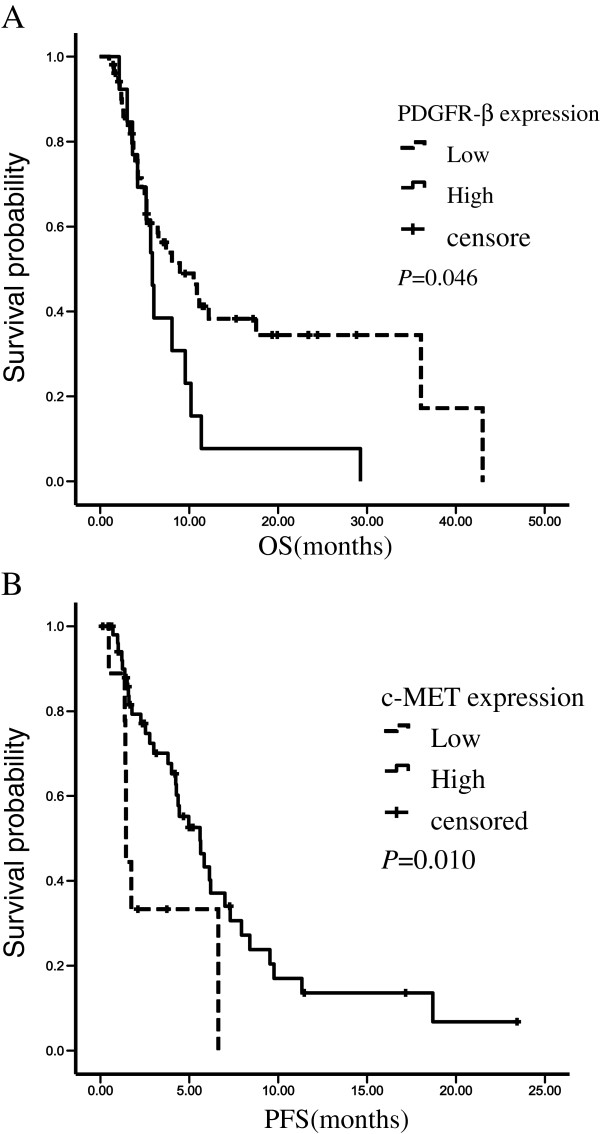
Figure 2.
Kaplan-Meier curves were plotted for PFS and OS. Patients were divided into high-expression group and low-expression group by PDGFR-β expression or c-MET expression. A: Overall survival curves stratified by PDGFR-β expression (p=0.046). B: Progression-free survival curves stratified by c-MET expression (p=0.010). PFS, progression-free survival; OS, overall survival.

