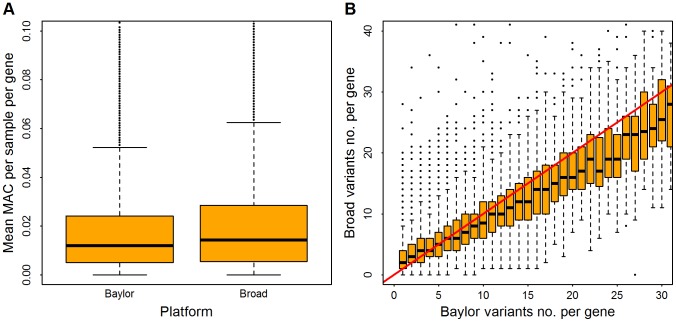
Figure 1. Distribution of rare variants per gene in Baylor and Broad data sets after filtering.
Minor allele counts (MAC) are restricted to variants with minor allele frequency  . Panel (A), distribution of mean MAC per sample, averaged over all genes. Panel (B), in the Baylor samples, genes were binned based on the counts of rare variants (which range from 1 to 30); for each bin the vertical axis shows the distribution of counts (boxplot) from the same genes in the Broad samples. The red line indicates an equal count in Broad and Baylor.

