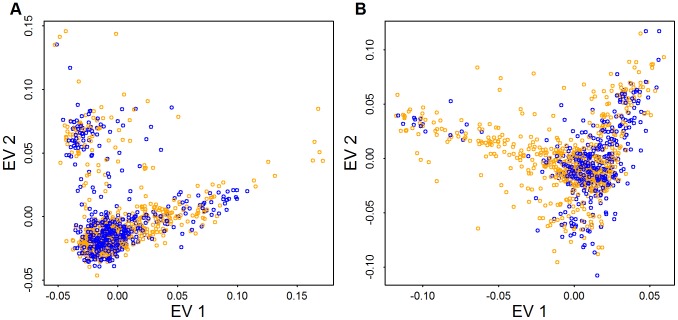
Figure 6. PCA for case (orange) and control (blue) samples.
Panels (A) and (B) plot the top two eigen-vectors for Baylor and Broad, respectively. Eigen-vectors are obtained by applying PCA to all common variants (CVs) that have no missingness (14,702 CVs used in Baylor and 56,607 CVs used in Broad).

