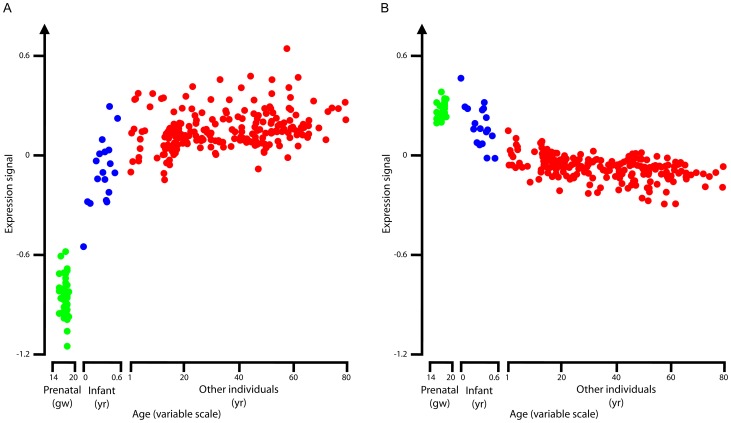
Figure 4. Average RNA expression levels.
Average RNA expression levels for the genes near the up H3K4me3 peaks (A) and for the genes near the down H3K4me3 peaks (B). Expression data were taken from [5]. Each dot indicates one sample, for which the expression levels of the genes near the up (or down) H3K4me3 peaks were averaged. Color scheme is the same as for Figure 2.

