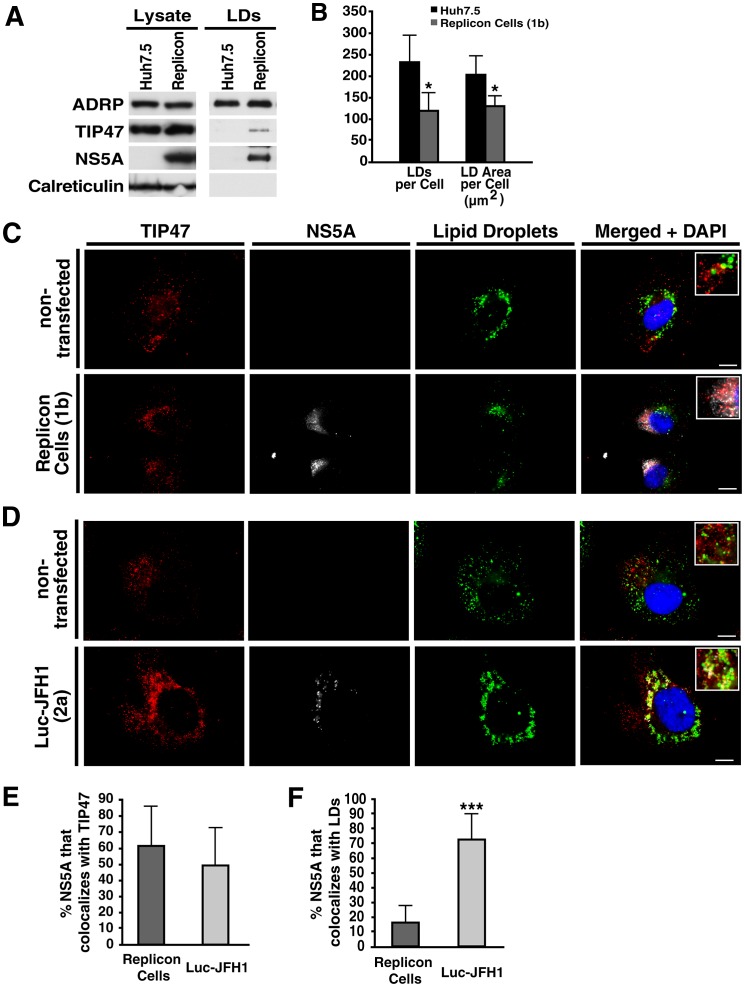
Figure 5. TIP47 associates with LDs during HCV infection.
A) Western blot analysis of cell extracts or isolated lipid droplet fractions from either naïve Huh7.5 or replicon Cells (genotype 1b). B) Quantification of number of LDs (RedO stain) and LD area per cell in either naïve Huh7.5 or replicon cells (genotype 1b) (mean ± standard deviation; n>100, *P<0.05). Quantification was done using Volocity software (Perkin Elmer). C) Indirect immunofluorescence of TIP47 (red) and NS5A (white) in either non-transfected Huh7.5 cells, or replicon Cells (genotype 1b), Lipid droplets were stained with Bodipy493/503 (green). The scale bar = 10 µm. The close-up images are shown with 2.5 fold higher magnification. D) Indirect immunofluorescence of TIP47 (red) and NS5A (white) in either non-transfected Huh7 Lunet cells, or transfected with full-length Luc-JFH1 (genotype 2a). Lipid droplets were stained with Bodipy493/503 (green). The scale bar = 10 µm. The close-up images are shown with 2.5 fold higher magnification. E) Quantification of the percentage of NS5A that colocalizes with TIP47 in either Replicon-expressing cells or Huh7 Lunet cells transfected with Luc-JFH1 (as seen in B) (mean ± standard deviation; n≥30). Quantification was done with the automatic colocalization program in Volocity software (Perkin Elmer). F) Quantification of the percentage of NS5A that colocalizes with LDs in either replicon-expressing cells (as seen in C) or Huh7 Lunet cells transfected with Luc-JFH1 (as seen in D) (mean ± standard deviation; n≥30, ***P<0.001). Quantification was done with the automatic colocalization program in Volocity (Perkin Elmer).

