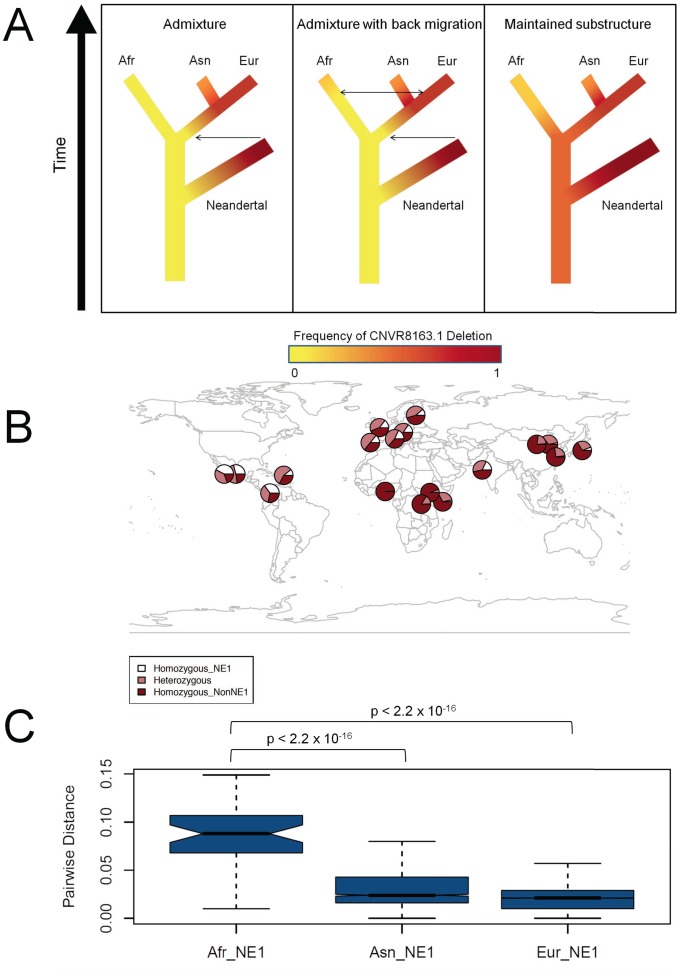
Figure 3. Ancient African origins of the NE1 haplogroup.
(A) Models of scenarios that could lead to NE1 haplotypes observed in humans and Neandertals. The frequency of the NE1 haplogroup is depicted in red and the frequency of the nonNE1 haplogroup in yellow. The red corresponds to higher frequencies, whereas yellow corresponds to lower frequencies of the NE1 haplotypes in the population. The arrows represent the direction of possible admixture events. The left panel represents a model, under which the NE1 haplotypes admixed into Eurasian populations (Asn and Eur) after Human-Neandertal divergence. The second model, which is depicted in the central panel, is similar to the first model, except with the addition of more recent back migration of Eurasian NE1 haplotypes into Africa (Afr). The right panel shows the third model, under which the NE1 haplotypes among humans are explained by persistence of ancient African substructure. All these scenarios were based on the assumption that the NE1 haplotype occurs at high frequency or is fixed in the Neandertal population given that the available Neandertal sequences align well to the NE1 haplotype. (B) Geographical distribution of the NE1 haplogroup. We estimated the proportion of chromosomes that carry the CNVR8163.1 deletion from various sources described in Materials and Methods . The dark red portion of each circle represents the frequency of the homozygous nonNE1 genotypes, the white represents the homozygous NE1 genotypes and the light red represents the frequency of heterozygote genotypes. Note the existence of the NE1 haplotypes (i.e., as heterozygotes, light red) among sub-Saharan African populations (e.g., LWK and ASW) as well as the high frequency of heterozygotes (light red) in the European populations. (C) The pairwise distances between the African (Afr) NE1 haplotypes, the Asian (Asn) NE1 haplotypes, and the European (Eur) NE1 haplotypes, calculated using phase 1 data from the 1000 Genomes Project. p-values were calculated by the Mann-Whitney test.

