
Figure 4. Selection acting on the NE1 locus.
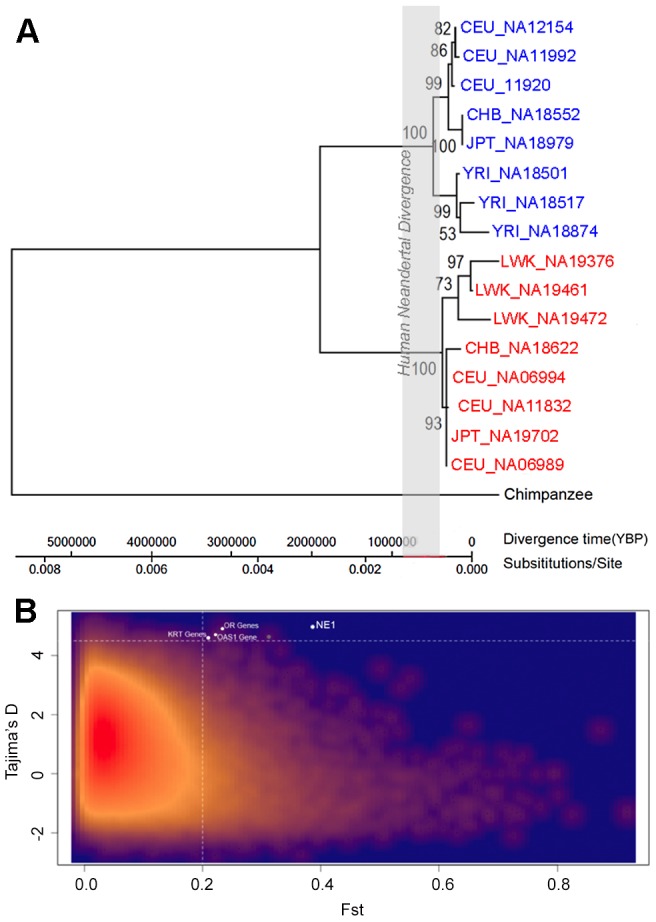
(A) Maximum likelihood tree based on select NE1 (red) and nonNE1 (blue) haplotypes, with the chimpanzee haplotype as an outgroup. The gray-box indicates the estimated interval for the Human-Neandertal divergence between 400,000–800,000 years ago [51]. Note that the coalescence at this locus is extremely long and very unlikely to have evolved under neutral conditions as modeled here. (B) Comparison of FST and Tajima's D values of 10 kb intervals across the human genome. The red to dark blue gradient indicates decreased density of observed events at a given location in the graph. The NE1 locus, and other loci with similar profiles, are highlighted in white.