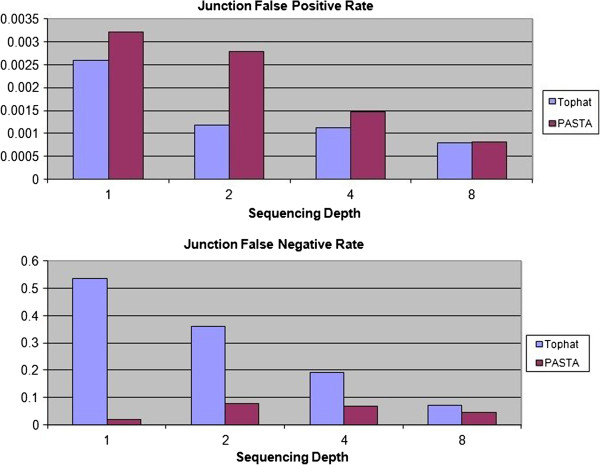
Figure 1.

Junction Accuracy of TopHat and PASTA. The blue bars represent TopHat predictions and the red bars represent PASTA predictions. Junction FP rates are shown in the top panel and junction FN rates are shown in the bottom panel. A total of 4 different sequencing depths were simulated.
