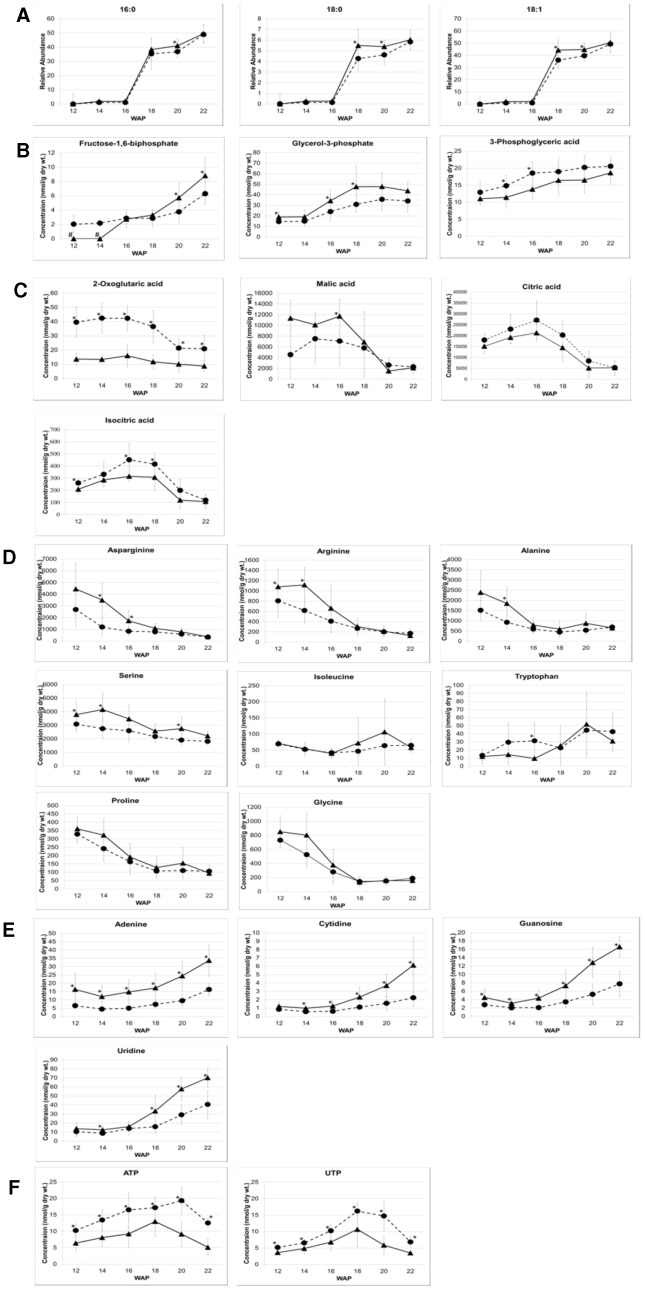
Figure 4. Differential metabolite profiles across key pathways during development of HY and LY palm mesocarp.
Significant differential mesocarp concentrations of selected metabolites in HY (▴) and LY (•) palms during 12–22 WAP (n = 8) for a) fatty acids, b) glycolytic pathway, c) TCA cycle, d) amino acids, e) nucleotides, f) other selected metabolites. Error bars show ± 1σ; *, p-value for difference <0.05; #, not detected.

