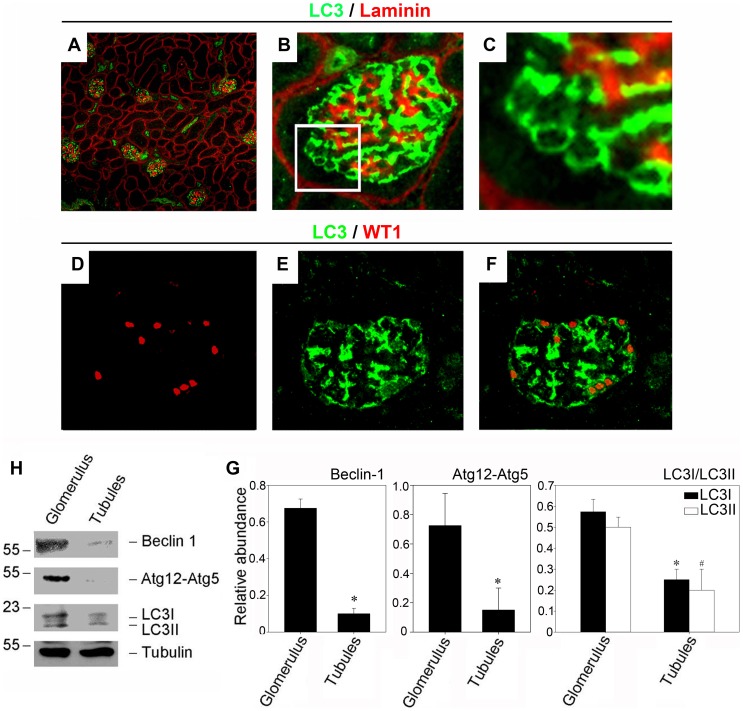
Figure 1. CD-1 mice exhibit high basal autophagy flux in glomerular podocytes.
(A–C): Kidney section were immunostained with anti-LC3 antibody (green) to identify autophagosomes, followed by staining with anti-Laminin antibody (red) to sever as a marker for the basement membrane. (A): Low power (×100) field micrograph showing the localization of autophagosomes in the kidney. (B and C): High power (×400) field micrograph further demonstrated the autophagosomes (stained with the anti-LC3 antibody, green) were localized mainly on the epithelial side of the glomerular basement membrane (stained with the anti-Laminin antibody, red) where the podocytes reside. (D–F): Immunofluorescence staining demonstrates the occurrence of autophagy in podocytes, as illustrated by colocalization of WT-1 staining to recognize podocytes (D) and LC3 staining to identify autophagosomes (E). Merging the LC3 and WT-1 staining images is presented in F. (H and G): Western blot analysis shows a comparable protein abundance of autophagy related proteins such as Beclin-1, Atg12-5, and LC3 in the glomeruli lysates and the tubule lysates. The lysates were immunoblotted with Ab's against Beclin-1, Atg12-5, LC3 and α-tubulin, respectively. The relative abundances are presented in B after normalization with α-tubulin. * P<0.05 (n = 3).

