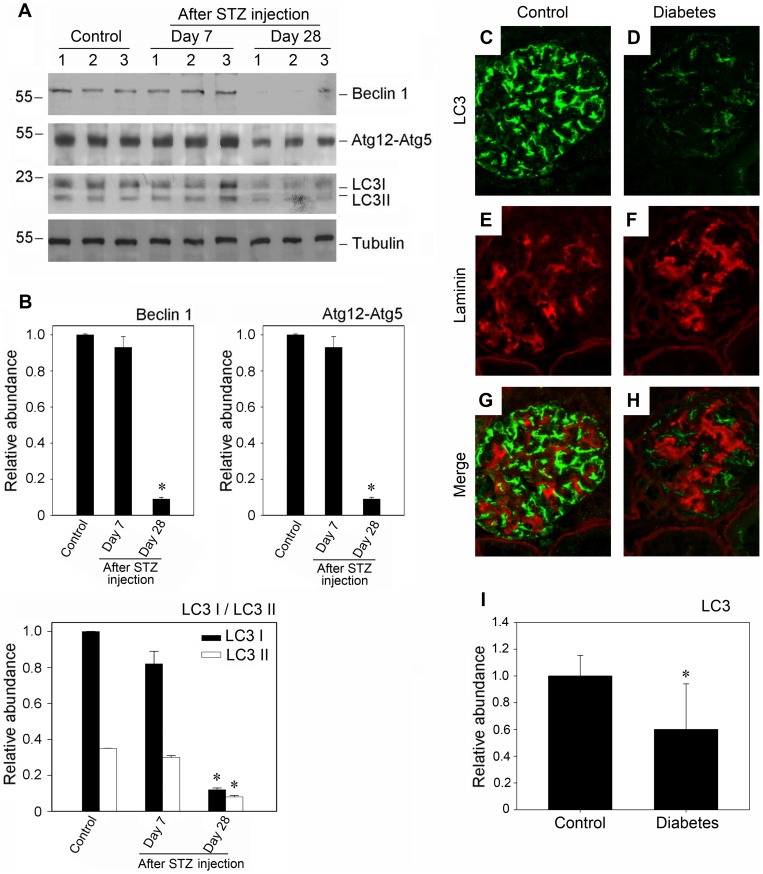
Figure 5. Suppression of autophagy in diabetic glomerular podocytes.
(A) Western blot analysis shows the level of autophagy related proteins in diabetic glomerular. The glomerular lysates were blotted with specific antibodies against Beclin-1, Atg12-5 and LC3, respectively. Samples from two individual animals were used at each timepoint. (B) Quantitative determination of Beclin-1, Atg12-5 and LC3 protein abundance after normalization with α-tubulin. *P<0.05 (n = 3). (C–D) Immunofluorescence staining shows the changes of autophagosomes in the diabetic glomerular (400× magnification). Kidney section were immunostained with anti-LC3 antibody (green) to identify autophagosomes, followed by staining with anti-Laminin antibody (red) to sever as a marker for the basement membrane.(C, E and G): control group; (D, F and H): the group of 28 day diabetic mouse. (I): Quantification of LC3 immunofluorescence staining in nondiabetic glomeruli and diabetic glomeruli. 30 glomeruli were evaluated for each experimental animal (n = 5) through the middle part of the kidney. Glomeruli that did not have a glomerular tuft or that were sectioned close to the edge were disregarded. Data are presented as mean ± SEM. *P<0.05 vs. normal control.

