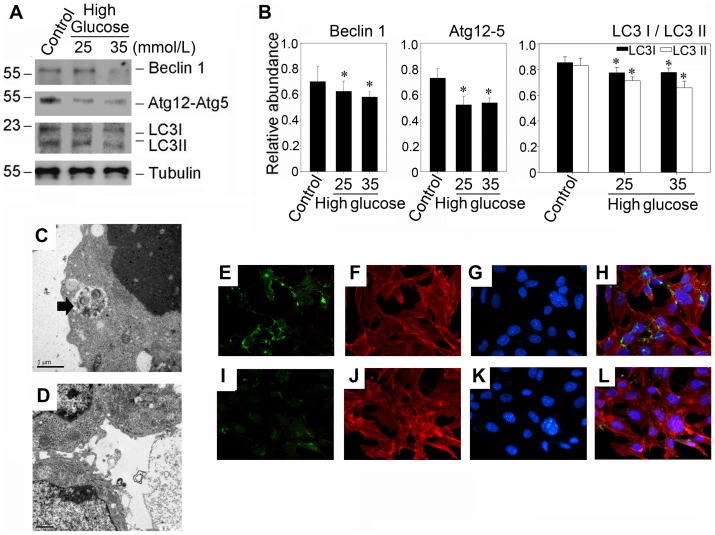
Figure 6. High glucose suppresses the expression of Beclin-1, Atg12-5 and LC3 in murine podocytes.
(A). Western blot results demonstrated that high glucose (25 mmol/L and 35 mmol/L) suppresses the expression of Beclin-1, Atg12-5 and LC3. Murine podocytes were treated with high glucose (25 mmol/L and 35 mmol/L) for 48 hours. (B): Quantitative determination of the relative abundance of Beclin-1, Atg12-5 and LC3. Data are presented as mean ± SEM of three independent experiments. *P<0.05 vs. normal control; (C and D): Representative electronic micrographs shows autophagosomal structures in podocytes treated without or with high glucose (25 mM) for 48 hours. The arrows indicate autophagosomes. Bar 1 μm. (C): control group; (D): high glucose group incubated in 25 mmol/L D-glucose for 48 hours; (E–L): Double imunofluorescence staining shows the localization of LC3 (green, first column); β-actin (red, second column), and cell nucleus (blue, third column) in podocytes treated without or with high glucose (25 mM) for 48 hours. Merging of β-actin, LC3 and cell nucleus staining is presented in fourth column (H and L). (E, F, G and H): control group; (I, J, K and L): high glucose group incubated in 25 mmol/L D-glucose for 48 hours.

