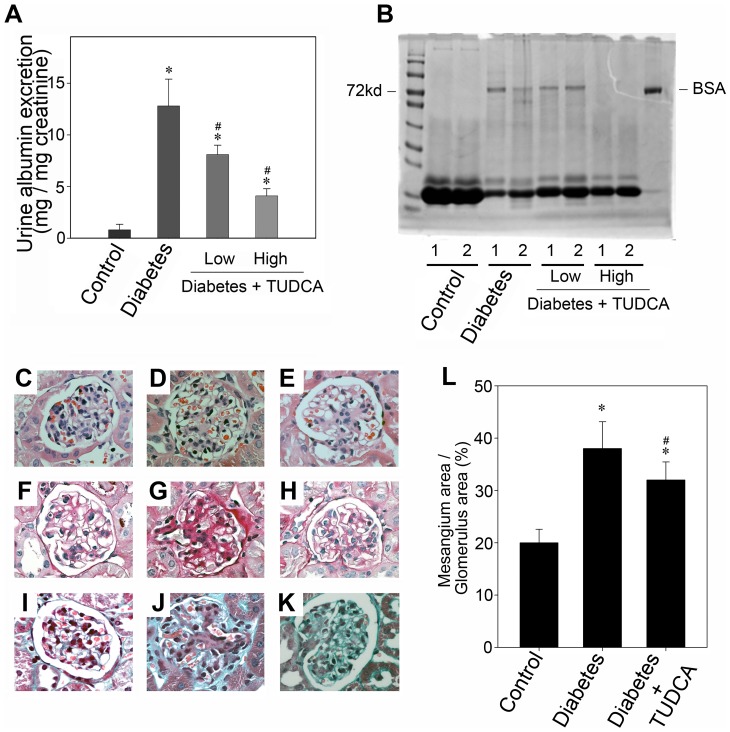
Figure 9. TUDCA attenuates albuminuria and improves histopathological lesion in diabetic mice.
(A) TUDCA attenuates albuminuria in diabetic mice. Shown is graphic presentation of urinary albumin/creatinine ratio. Data are presented as means ± SEM of three experiments. n = 6; * P<0.05 vs. normal control. # P<0.05 vs. the group of 28 day diabetic mouse. (B) Representative SDS-PAGE shows the urine proteins in different groups of mice as indicated. Numbers (1 and 2) denote each individual animal in a given group. (C–K) The light microscopic appearance of representative glomeruli (400× magnification) is shown stained with H&E (C–E), PAS (F–H), and Masson's trichrome (I–K). The left column (C, F and I): control group; The second column (D, G and J): diabetic group; The third column (E, H and K): diabetic group treated with 500 mg/kg/day TUDCA. (L): Quantification of extracellular mesangial matrix area in relation to glomerular tuft area. Results are expressed as average percentage of glomerular area occupied by the mesangial matrix. 30 glomeruli were evaluated for each experimental animal (n = 6) through the middle part of the kidney. * P<0.05 vs. normal control. # P<0.05 vs. the group of 28 day diabetic mouse.

