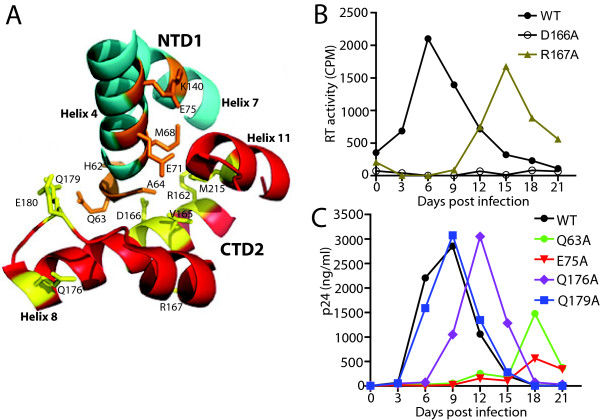
Figure 2.
Impaired replication of NTD-CTD mutants in CEM cells. (A) Structural view of the NTD-CTD interface showing two different subunits, NTD1 (blue) and CTD2 (red) and the side chains of residues target for mutagenesis. (B and C) CEM cells were inoculated with 5 ng of virus or an equivalent quantity based on RT units. Supernatants were sampled from the culture media after every 3 days as indicated and viral accumulation analyzed by p24 ELISA or by in vitro RT assay. The results shown are the mean values of duplicate determinations.

