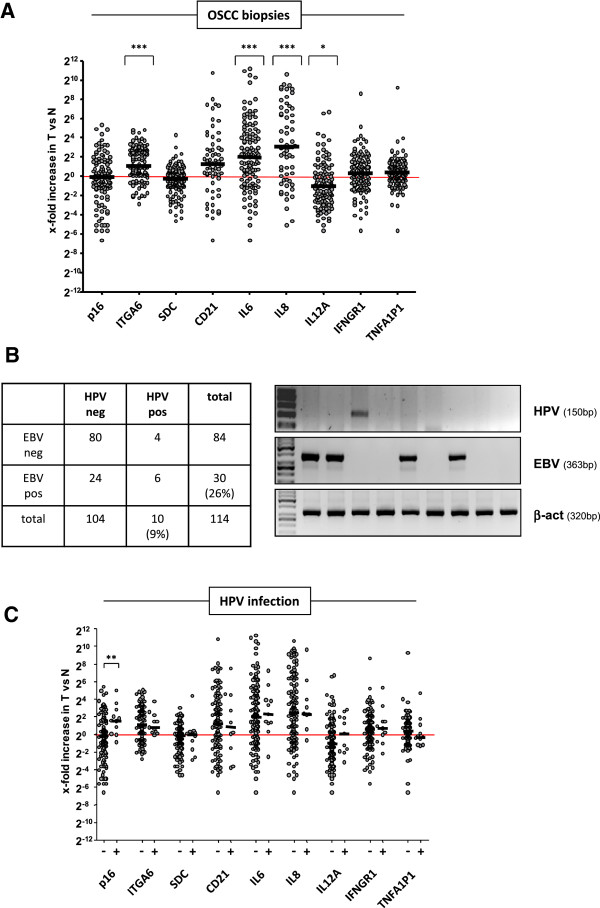
Figure 1.
Gene expression profile and infection with HPV and EBV in OSCC tissue. (A) A total of 114 OSCC biopsies (T) was tested for the expression of the indicated genes by quantitative Light Cycler RT-PCR which is represented as x-fold increase compared to non-cancerous normal (N) tissue from the same patient. GAPDH expression served as internal control and was used for normalisation of gene expression data. The baseline at 20 indicates no difference in expression between N and T. Statistics were done to compare the significance of gene expression in T versus N using the 2-tailed non-parametric Mann–Whitney test. Shown are the median values to account for outliers. *, p<0.05; **, p<0.01; ***, p<0.001. (B) Representative agarose gel showing conventional PCR results for the detection of HPV and EBV sequences in the OSCC genomic DNA. Separate amplification of ß-actin served as control for DNA integrity. The table summarizes the total number of OSCC samples that were positive or negative for HPV and EBV, respectively. Percentages in brackets illustrate HPV and EBV infection, respectively. (C) Quantitative Light Cycler RT-PCR data from (A) are depicted depending on HPV infection. Note that only upregulation of p16 in HPV positive OSCC samples reached statistical significance compared to HPV negative samples.

