
Figure 1.
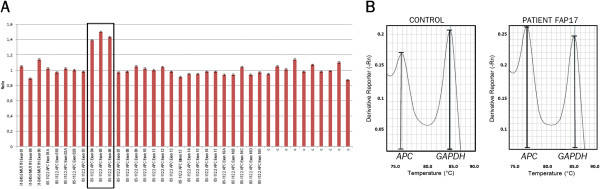
Duplication encompassing exons 1 to 3 of the APC gene (patient ID17). A: MLPA graphic showing normalized ratios of probes ordered by genomic position; the box marks the probes that indicate duplication of APC exons 1, 2, and 3 (exons 4, 5, and 6 according to MLPA exon numbering [GenBank:NG_008481]). B: Melt curve of duplex qPCR of APC exon 2 and GAPDH intron 7 (reference gene). The ratio of APC/GAPDH peaks of the melting curve was 0.72 in the control sample and 1.06 in patient ID17, leading to a normalized ratio of 1.47 for the FAP patient, which confirms the duplication.