
Figure 2.
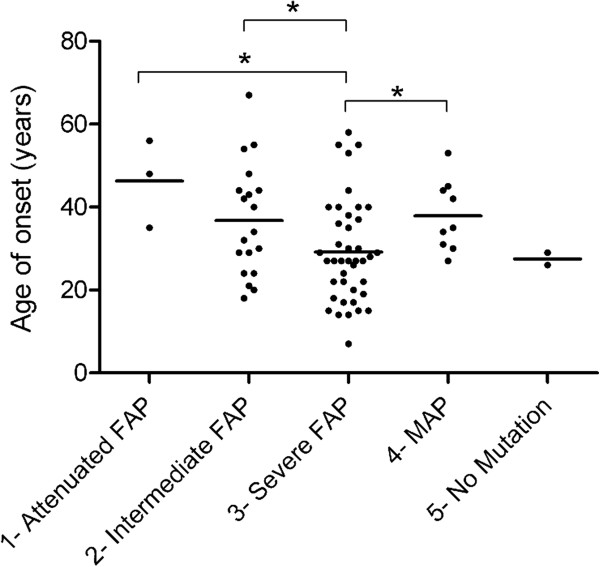
Age of onset per group. The graph shows the distribution and the mean (horizontal line) age of onset for each of the five defined groups. Groups 1, 2, and 4 patients had a significantly later age of onset than group 3 patients (t = 2.35 p = 0.024; t = 2.15 p = 0.04; t = 2.01 p = 0.05, respectively).