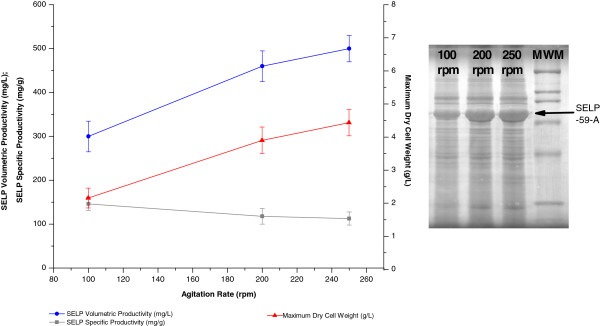
Figure 5.

Effect of agitation rate on biomass and SELP production. Comparison of maximum SELP-59-A volumetric (blue) and specific (grey) productivities as well as maximum biomass levels measured (red) as a function of the rate of culture agitation. The maximum biomass values represent the highest dry cell weights (DCW, g/L) measured over the course of the experiment. The SELP-59-A volumetric and specific productivities were estimated from comparisons of band intensities on a sodium dodecyl sulphate polyacrylamide gel with a band of known concentration. On the right is shown the SDS-PAGE analysis of the effect of the agitation rate (150, 200 and 250 rpm) on SELP-59-A production. The position of the SELP-59-A band is indicated. A broad range SDS-PAGE molecular weight marker (Biorad) is also shown (MWM). rpm: rotations per minute.
