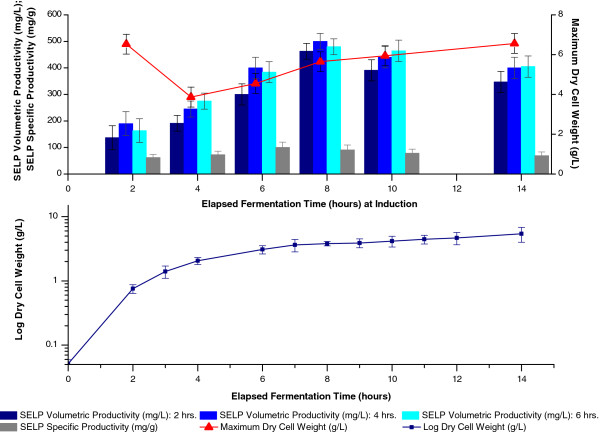
Figure 6.
Effect of elapsed fermentation time at induction and induction period on biomass and SELP production. Comparison of maximum SELP-59-A volumetric (blue) and specific (grey) productivities as well as maximum biomass levels measured (red) as a function of the elapsed fermentation time (EFT) at induction (2–14 hrs.incubation) and the induction period (2, 4 and 6 hrs.) (top). Growth curve of uninduced E.coli BL21(DE3) for comparison of the elapsed fermentation time at induction with the stage of growth (bottom). Cultures were induced with 1 mM IPTG. The EFTs at induction correspond to induction during the exponential (2 hrs. EFT, 0.75 g/L DCW), declining exponential (4 and 6 hrs. EFT, 2 and 3 g/L DCW), early stationary (8 hrs. EFT, 4 g/L DCW), stationary (10 hrs. EFT, 4 g/L DCW) and late stationary (14 hrs. EFT, 5 g/L DCW) phases of growth. The maximum biomass values represent the highest dry cell weights (DCW, g/L) measured over the course of the experiment. The SELP-59-A volumetric and specific productivities were estimated from comparisons of band intensities on a sodium dodecyl sulphate polyacrylamide gel with a band of known concentration.

