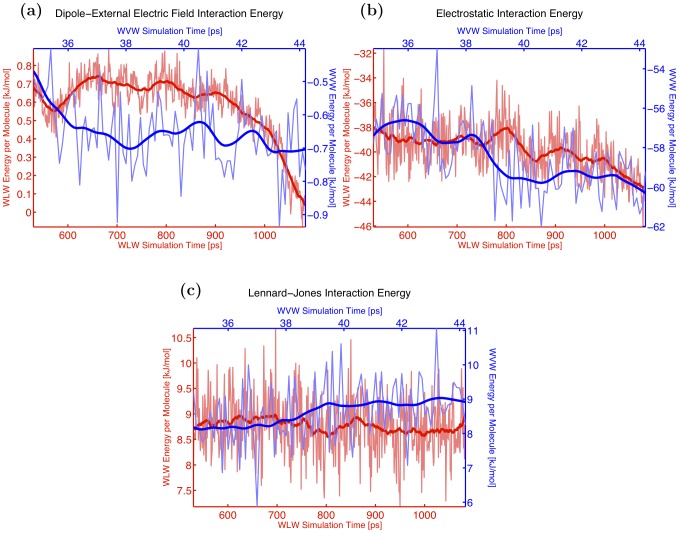
Figure 6. Constituent terms of total interaction energy.
Comparison of constituent terms of the total interaction energy per protrusion molecule between WLW (red curve) and WVW (blue curve) simulations: (a) dipole–external electric field interaction energy, (b) electrostatic interaction energy, (c) Lennard-Jones interaction energy.

