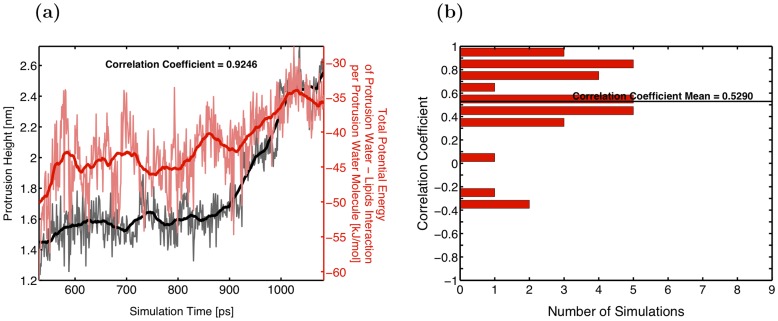
Figure 7. Correlation between protrusion height and total interaction energy in WLW.
A graph (a) and a histogram of the correlation coefficient (b) demonstrating positive correlation between the protrusion height growth and the increase in the total interaction energy between the protrusion waters and the lipids in WLW simulations.

