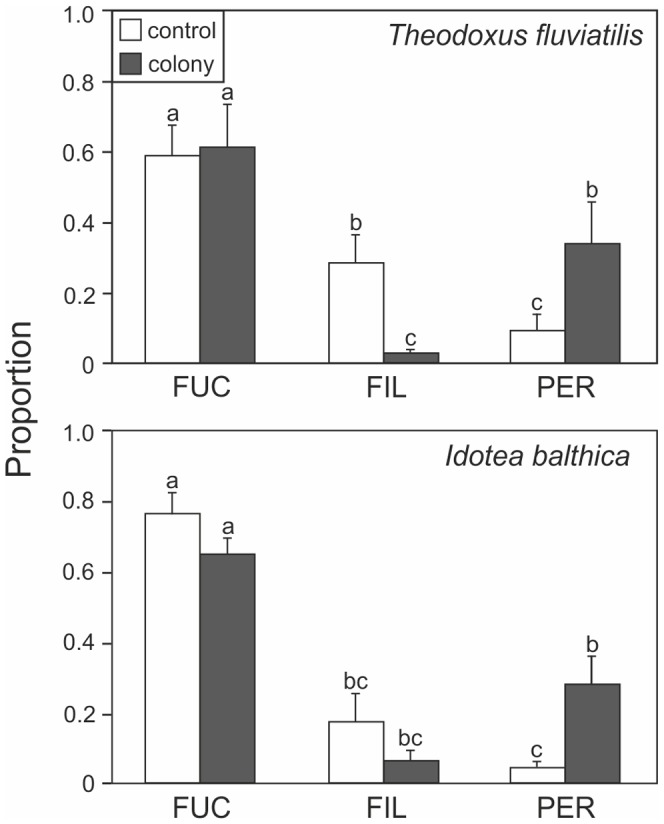
Figure 6. Proportion of sources (mean ± SE) from diet analysis of Idotea balthica and Theodoxus fluviatilis from colony and control sites.

Results shown are based on diet mixing analysis using diet-dependent trophic fractionation factors following Caut et al. [34], given in Table 2. FUC = Fucus vesiculosus, FIL = filamentous algae (Cladophora glomerata and Ulva spp.), PER = periphyton.
