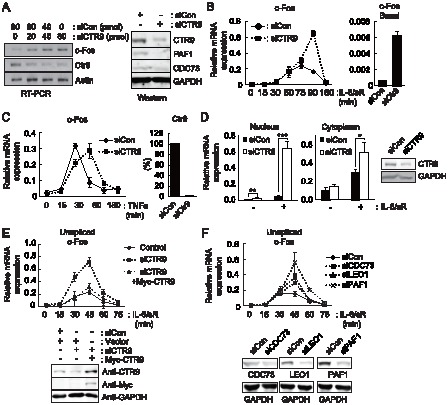
Figure 1. c-Fos transcription is negatively regulated by PAFc in the nucleus.

A, Left, transcript levels of c-Fos, Ctr9 and Actin were analyzed by RT-PCR in HepG2 cells transfected with control siRNA (siCon) or CTR9 siRNA (siCTR9), as indicated above. Right, endogenous protein levels of PAFc components in CTR9 knockdown cells were measured by western blot analysis. B, IL-6-induced and basal c-Fos expression was analyzed by Real-time RT-PCR (RT-qPCR). HepG2 cells were transfected with either control or CTR9 siRNA. Approximately 48 hours later, cells were treated with IL-6 plus IL-6sR (20 ng/ml each) for the indicated length of time. Expression levels were normalized to β-Actin. C, Cells were transfected with Control or CTR9 siRNA. 48 hours later, cells were treated with TNFα (20 ng/ml) for the indicated length of time. D, Left, Nuclear and cytoplasmic RNA were prepared using the PARIS kit. The levels of c-Fos mRNA in the nuclear and cytoplasmic fractions were then analyzed by RT-qPCR. Right, endogenous protein levels of CTR9 in control and knockdown cells were measured by western blot analysis. E, Cells were transfected as indicated. 48 hours later, cells were treated with IL-6 plus IL-6sR (20 ng/ml each) for the indicated length of time. The unspliced c-Fos transcripts were analyzed by RT-qPCR. Bottom, endogenous protein levels of CTR9 and exogenous Myc-CTR9 were measured by western blot analysis. F, PAFc components were individually knocked down by transient siRNA transfection. Samples were prepared and analyzed as described in E. Bottom, endogenous protein levels of PAFc components were measured by western blot analysis. **p<0.01, ***p<0.001 by Student's t test. Error bars represents standard deviation(SD) (n = 3).
