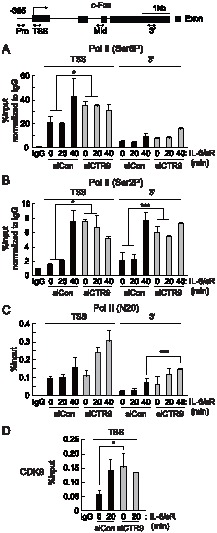
Figure 2. Elongating RNA Pol II pre-occupies the c-Fos locus in the CTR9-deficient cells.

Top, diagram of the c-Fos genomic loci. Every PCR primers used for ChIP analyses in this study are shown as two-sided arrows. HepG2 cells were transfected with control siRNAs or CTR9 siRNAs and treated with IL-6 plus IL-6sR (20 ng/ml each) for the indicated length of time. ChIP analyses were performed with soluble chromatin using antibodies as indicated: anti-Ser5P CTD (A), anti-Ser2P CTD (B), anti-RNA polymerase II N-terminus (C), and anti-CDK9 (D),. Bound DNA was analyzed by quantitative PCR using primers specific to c-Fos loci. *p<0.05, ***p<0.001 by Student's t test. Error bars represents SD (n = 3).
