
Figure 5.
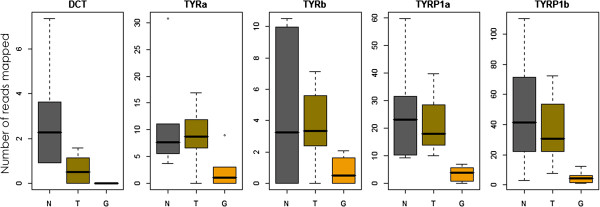
Expression levels of members of the tyrosinase gene family in three different Midas cichlid fish color morphs. The number of mapped reads was normalized using the method implemented in edgeR.
Official websites use .gov
A
.gov website belongs to an official
government organization in the United States.
Secure .gov websites use HTTPS
A lock (
) or https:// means you've safely
connected to the .gov website. Share sensitive
information only on official, secure websites.
Expression levels of members of the tyrosinase gene family in three different Midas cichlid fish color morphs. The number of mapped reads was normalized using the method implemented in edgeR.