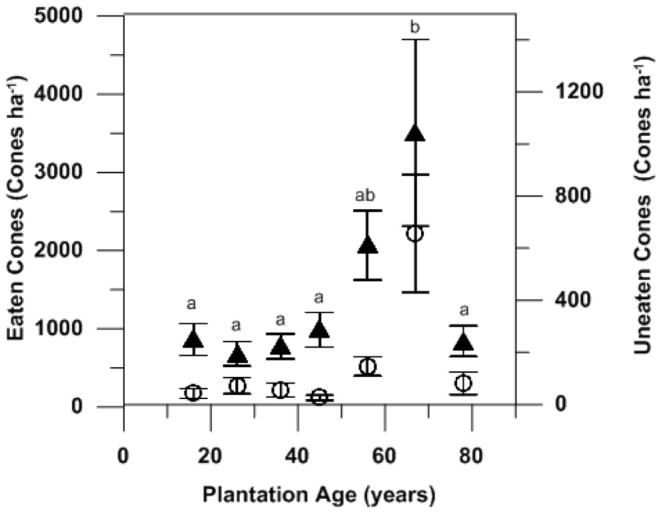
Figure 5. Numbers of eaten (fully or partially-solid diamond) and uneaten (retained in canopy–open circle) pine cones sampled across 122 quadrats at 61 sites across the Gnangara pine plantations in July to August 2009.

Different letters indicate Tukey post-hoc significant differences (P<0.05) between plantation ages after One-way ANOVA F6,115 = 5.499, p<0.05).
