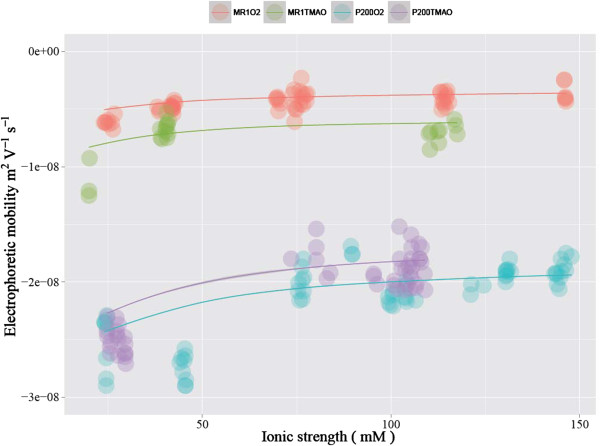
Figure 5.
Experimentally measured EPMs for 6 ≲ pH ≲ 9 are plotted as a function of ionic strength. In addition, the optimized EPM function (Equation (1) calculated using the optimized λ-1 and ρ value pairs) are shown as lines. The optimized λ-1 and ρ value pairs used to calculate the best-fit EPM function lines are reported in Table 1.

