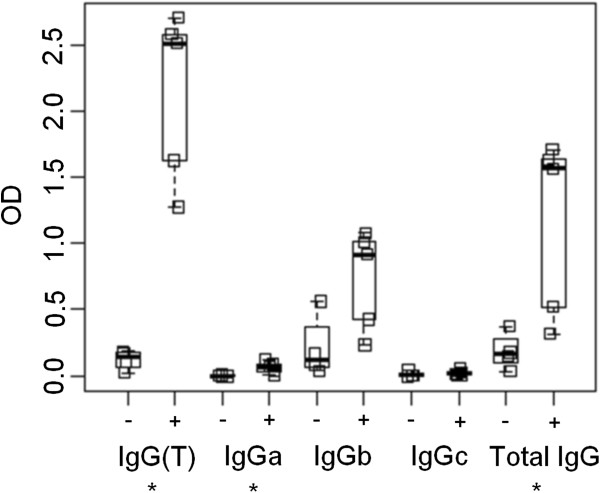
Figure 5.

Boxplot showing optic density (OD) readings of the enzyme-linked immunosorbent assay with antigen specific IgG subclasses grouped by Strongylus vulgaris infection status. -: no S. vulgaris larvae; +: S. vulgaris larvae present in the cranial mesenteric artery or branches. The middle black line of the box is the median and the range of the box is the inter quartile range (IQR) giving the first and third IQR. The lower and upper lines are up to 1.5 IQR away from the first and third quartile. Each square represents the mean OD450nm reading from one serum sample for each IgG subclass. Asterisks denote significant differences (p<0.05) between uninfected and infected horses within each IgG subclass.
