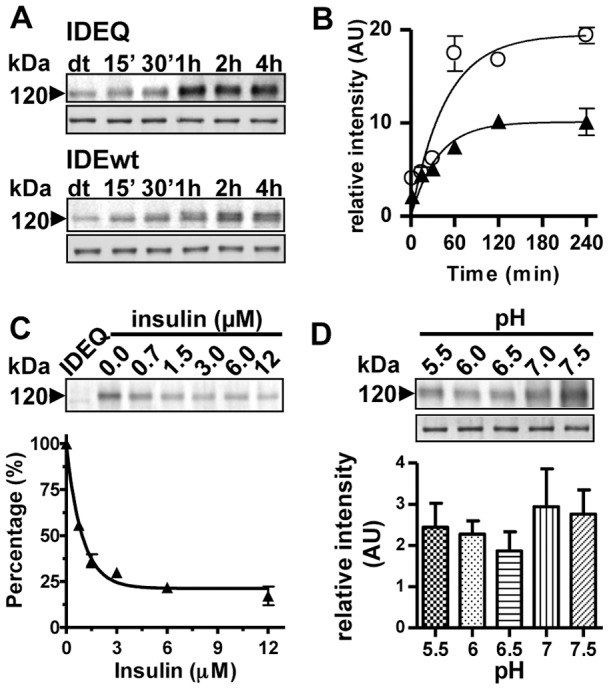
Figure 1. Time-course, amount and pH-dependence of the formation of complexes between Aβ1-42 and IDEwt or IDEQ.

(A) Western blots with anti-Aβ 6E10 showing the ∼120 kDa band corresponding to IDE-AβSCx (IDE-Aβ stable complex) as a function of the incubation time. Top panel, IDEQ; lower panel, IDEwt. Both PVDF membranes were developed simultaneously with a STORM 860 scanner. Below each Western blot, the same membranes stained with Coomassie blue, show IDEwt or IDEQ loading. (B) Densitometric data from Western blots for IDEQ (◯) and IDEwt (▴) were fitted to a single exponential equation using Graph Pad Prism v.4 software. Points represent the mean ± SEM from two independent experiments in duplicate. (C) IDEQ-AβSCx formation is partially competed by pre-incubation for 1 h with insulin at the indicated molar excess before the addition of Aβ1-42. Data are expressed as the percentage of the remaining Aβ-positive band at ∼120 kDa, in arbitrary units, as a function of insulin concentration. Each point represents the mean ± SEM of two independent experiments in duplicate. Inset: a representative Western blot of IDEQ-AβSCx developed with 6E10. (D) Densitometry of IDEQ-AβSCx at the indicated range of pH as determined by Western blot with anti-Aβ. Bars represent the mean ± SEM of three separate experiments. Inset: top, representative Western blot with anti-Aβ of IDEQ-AβSCx; bottom, Coomassie blue of IDEQ loaded in each lane. In panels (A), (C) and (D), IDEwt or IDEQ-AβSCxs are indicated by arrowheads.
