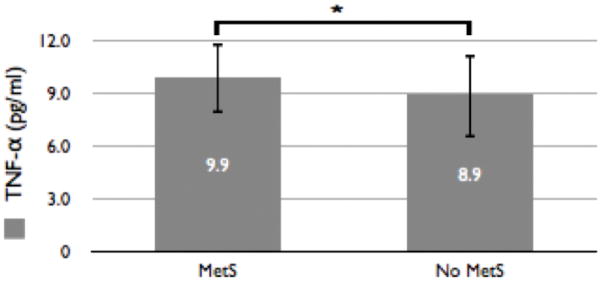
Figure 1. Distribution of TNF-α by Diagnosis of Metabolic Syndrome.

This figure outlines the differences in average TNF-α concentrations between those participants meeting criteria for metabolic syndrome and those without. The average TNF-α concentration in participants meeting criteria for metabolic syndrome (n = 26; 10.2 +/− 2.0 pg/ml) is higher (with results trending towards significance; T52=2.0, p=0.05) than in participants without metabolic syndrome (n = 70; 8.9 +/− 2.4 pg/ml).
