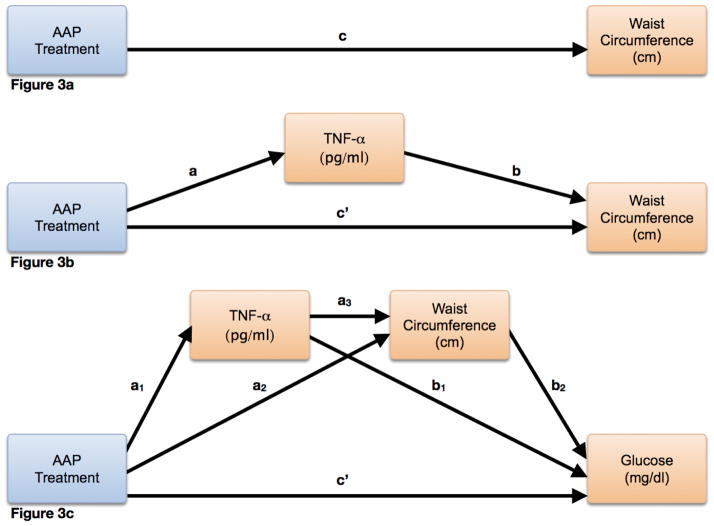
Figure 3. Schematic Representation of Mediation Analyses.
These schematic diagrams outline the mediation models used to test the corresponding hypotheses in the manuscript. This was adapted from prior work by Preacher, Hayes, and colleagues[34,35]. In Figure 3a, the general hypothesis that AAP treatment may have an impact on waist circumference is modeled. The overall (i.e. direct) effect is represented by c. Figure 3b builds on the model in figure 3a, modeling the simple hypothesis that the TNF-α variable plays an intervening role in the indirect relationship between AAP treatment and waist circumference. In this model, the direct effect is represented by c′ and the indirect effect is represented by both a and b. This model is further evolved in Figure 3c, using a serial mediation approach to test whether an indirect effect on the relationship between AAP treatment and serum glucose concentration exists and is explained by 2 serial intervening variables, TNF-α and waist circumference. The direct effect is again represented by c′, and the indirect effect is represented by a1, a3, and b2. Other partial effects are represented by a2 and b1.

