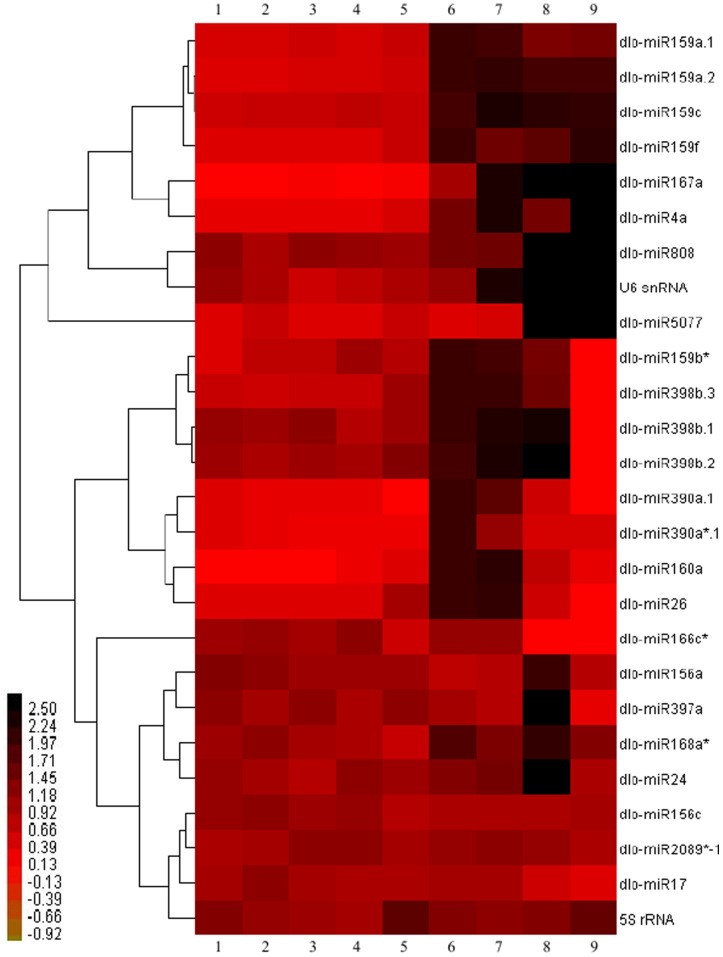
Figure 3. qPCR analysis of relative expressions of known and novel miRNAs, 5S rRNA, and U6 snRNA during longan SE.
The bar represents the scale of relative expression levels of miRNAs, and colors indicate relative signal intensities of miRNAs. Each column represents a sample, and each row represents a single miRNA. Samples: 1. friable-embryogenic callus(EC); 2. embryogenic callus II(EC II); 3. incomplete compact pro-embryogenic cultures(ICpEC); 4. compact pro-embryogenic cultures(CpEC); 5. globular embryos(GE); 6. heart-shaped embryos(HE); 7. torpedo- shaped embryos(TE); 8. cotyledonary embryos(CE); 9. mature embryos(ME).

