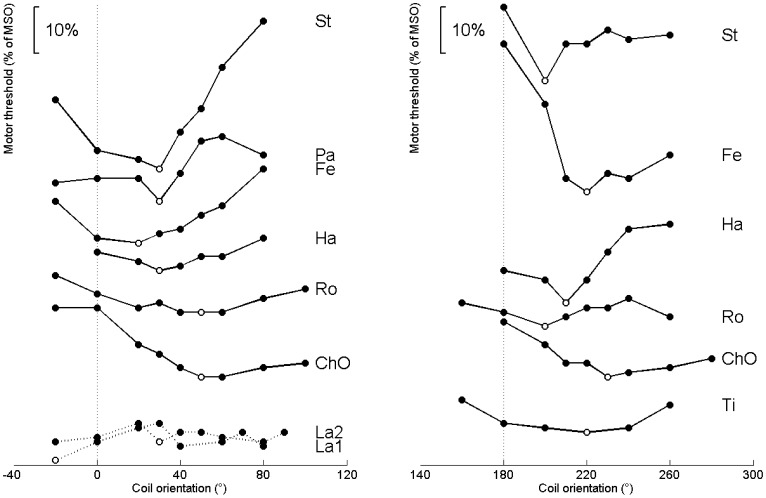
Figure 3. Recordings of threshold vs. coil orientation for each subject (labeled with acronyms).
The reference coil orientation for each session is indicated with a dotted vertical line. The minimum values for each subject are highlighted with open circles. In the left panel the recordings for session 1 with the standard coil orientation as reference are shown. The right plot shows the recordings for session 2. Note that the individual curves are vertically shifted for best presentability. Subject ‘La’ was excluded from further analysis as no clear minimum could be estimated in two sessions. For the sake of completeness subject ‘La’ is still shown in this figure.

