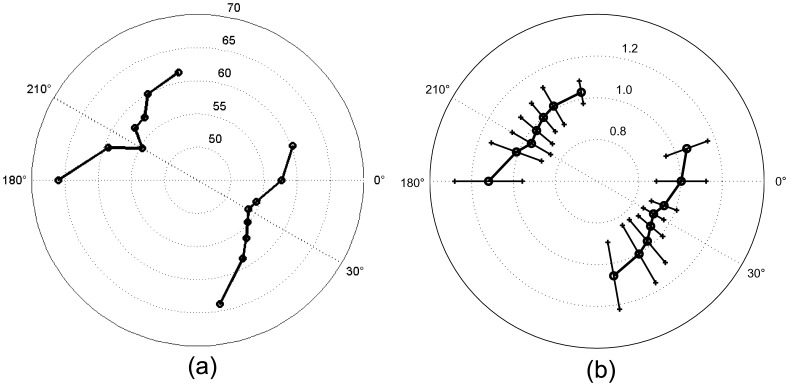
Figure 4. Polar plots of the motor thresholds averaged throughout subjects.
(a) shows the average of the real MTs (cf. Table 1); (b) shows the average of the standardized values with error bars (cf. Table 2). For both subplots: Recordings on the right side represent the findings for the standard coil orientation. Recordings in the left part were obtained with the coil handle towards the left hemisphere. Threshold minima occur in opposite positions as expected for a biphasic pulse.

