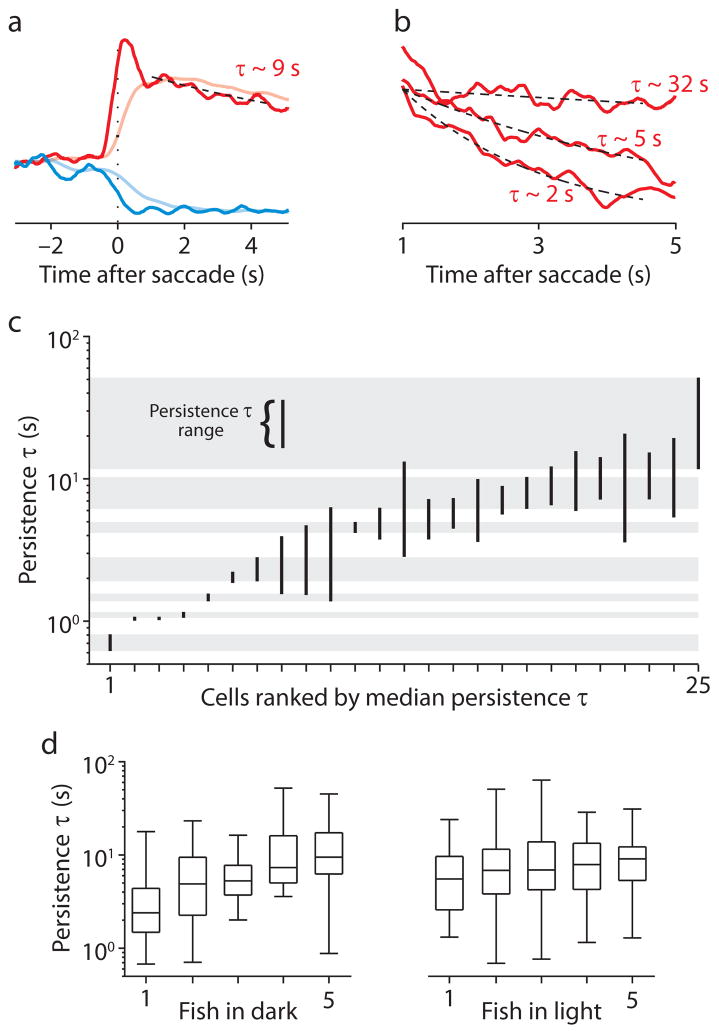
Figure 4.
The distribution of persistence time ranges within individual larvae. (a) Representative ipsiversive (red) and contraversive (blue) STA fluorescence responses, before (translucent) and after (opaque) deconvolution with a CIRF. The mean of the first 1.5 s of each trace is subtracted off. The black dashed line is the fit of an exponential function (τ= 9.26 s) to the deconvolved ipsiversive STA response from 1 to 4.5 s after saccade time. (b) Ipsiversive STA fluorescence responses from three cells in one fish from 1 to 5 s after saccade time. Black dashed lines show exponential fits with time constants indicated. Traces are normalized to the value of the fit 1 s after saccade time. (c) Persistence time ranges for 25 cells imaged in one fish in the dark. The vertical extent of each bar spans the persistence time range for each cell. Gray bars indicate non-overlapping persistence time ranges. Cells are ordered according to their rank in terms of the median of their persistence time distribution. (d) Box plots representing the distribution of median persistence times for fish imaged in the dark (left panel) or the light (right panel). Horizontal lines indicate the minimum, 25th percentile, median, 75th percentile, and maximum values of each distribution.

