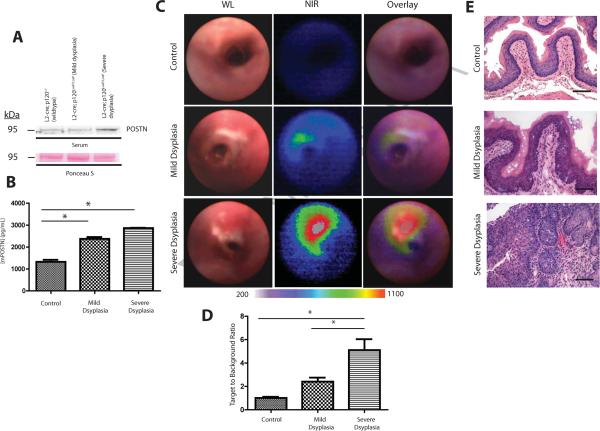
FIGURE 2. Periostin expression is detected with increasing ESCC progression in genetic mouse model of ESCC.
A. Immunoblot of periostin expression in mouse sera from three cohorts of mice at different stages of disease: control L2-cre; p120ctnLoxP/+, L2-cre; p120ctnLoxP/LoxP with mild dysplasia and L2-cre; p120ctnLoxP/LoxP with severe dysplasia (n=6 mice from each group). Ponceau S staining of immunoblot was performed as loading control.
B. ELISA of periostin levels present in mouse sera from the above three cohorts of mice. (n=6 mice from each cohort). Error bars represent +/− SEM *p<0.05
C. Representative white light (WL), near infra-red (NIR) and overlay images from upper GI endoscopies in mice from the above three cohorts. Color map represents range of fluorescent signal intensities (200–1100) in images.
D. Quantification of fluorescent signal from periostin optical probe detected from upper GI endoscopies in mice from the above three cohorts (n=3 from each cohort). Bar graphs represent TBR +/− SEM *p<0.05
E. Histopathological analysis of representative esophagi isolated from mice from the above three cohorts in top to bottom panels. Scale bars are 100 μM.

