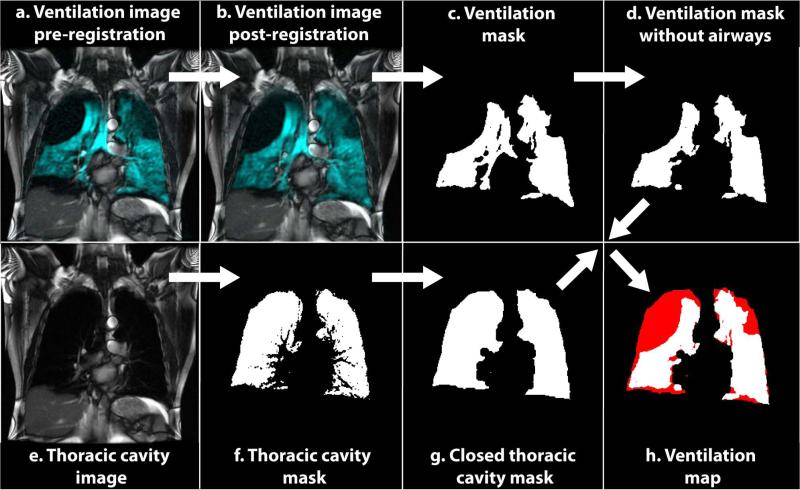
Figure 1.
Semi-automated analysis flowchart. Original 129Xe ventilation images (a) were registered to the 1H SSFP images (b), and then segmented to obtain an initial ventilation mask (c). Airways were removed from (c) to obtain the final ventilation mask (d) from which the ventilated volume (VV) was calculated. Original 1H SSFP anatomical images (e) were segmented to obtain an initial thoracic cavity mask (f). This mask was morphologically closed to obtain the final thoracic cavity mask (g) from which the thoracic cavity volume (TCV) was calculated. VV (white) and TCV (red) were then combined to map ventilation defects (h).

