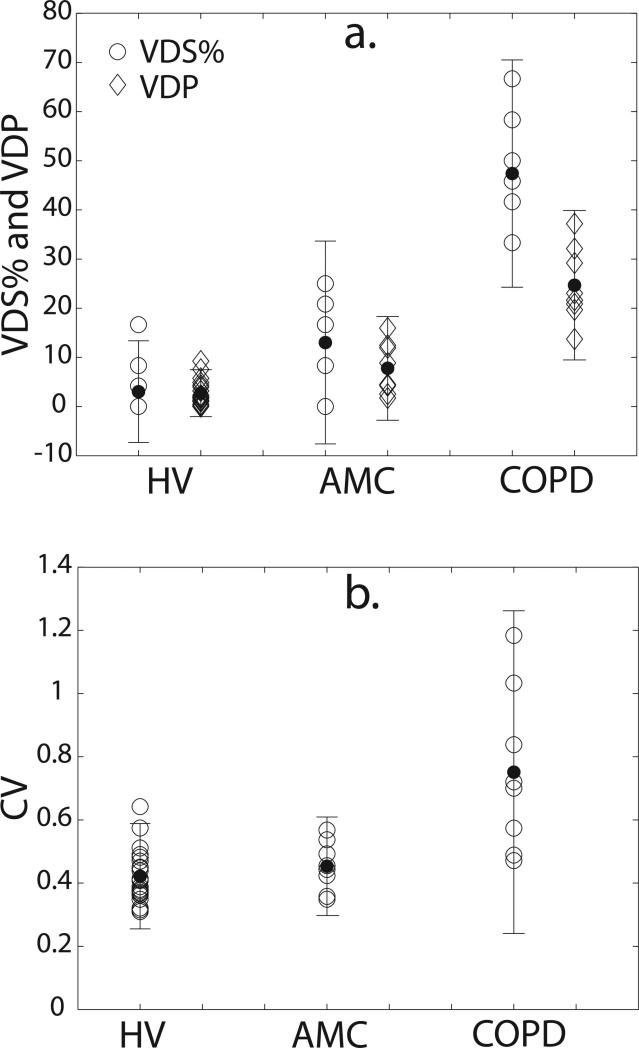
Figure 5.
Group-wise comparison of (a) VDS% and VDP (b) CV for all subjects (open symbols). Error bars are 95% confidence intervals about the group mean (closed symbols). For VDS% and VPD, all groups are significantly different from one another. For CV, the HV and AMC groups are significantly different from the COPD group but not from each other. P-values for all comparisons are provided in Table 1.

