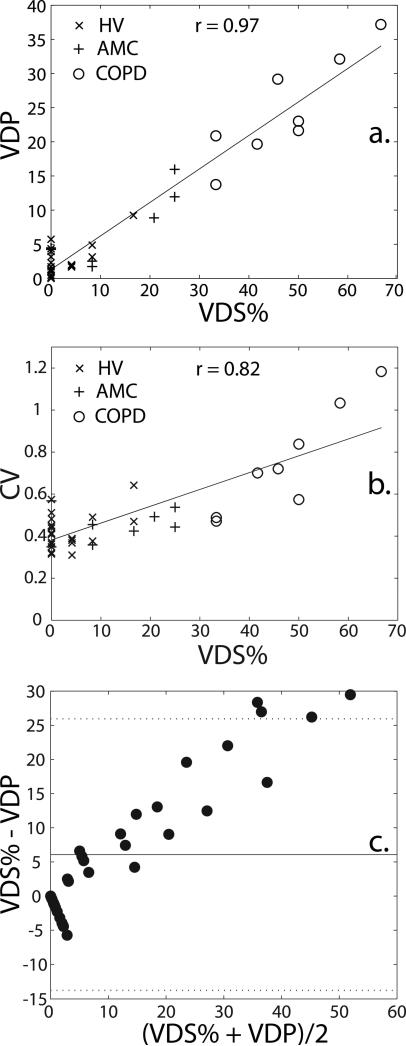
Figure 6.
Correlation of the expert reader-based VDS% with (a) VDP [VDP = 0.49×VDS% + 1.30; R2 = 0.94; p < 0.0001] and (b) CV [CV = 0.008×VDS% + 0.382; R2 = 0.68; p < 0.0001]; (c) Bland-Altman plot for VDS% and VDP for all subjects. The solid line indicates the mean difference between VDS% and VDP (6.07 ± 10.15) and the dotted lines indicate 95% limits of agreement (lower limit: -13.8, upper limit: 26.0).

