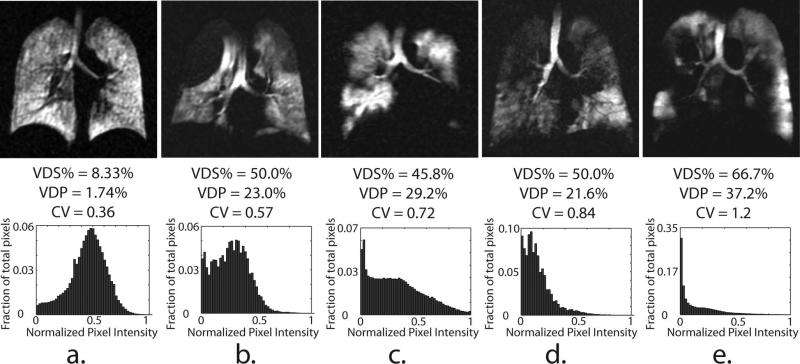
Figure 7.
Representative central slices of 129Xe ventilation images (upper panel) and normalized, whole-lung histograms (lower panel) from a HV (a) and 4 COPD subjects (b-e) ranked in increasing order of the CV. Note, subjects b-e have a similar VDS% (45-50), and VDP (21-23%) but markedly different histograms shapes.

