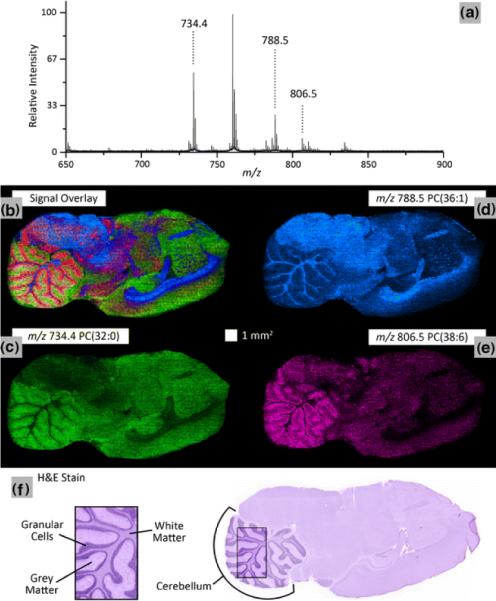
Figure 16. High-Speed MALDI IMS.

A 100 μm spatial resolution lipid ion image of a sagittal rat brain tissue section using continuous laser raster sampling acquired in 10 min. (a) Representative spectrum is shown. The ion image overlay (b) of signal from m/z 734.4 PC(32:0) (c), m/z788.5 PC(36:1) (d), and m/z 806.5 PC(38:6) (e) highlights the differentiation of the spatial distributions for the selected ions. These results correlate to the H and E stained serial tissue section highlighting structural difference between grey matter, white matter and granular cells in the cerebellum (f). Important instrumental parameters: 3 kHz laser repetition rate, 5 mm/s sample stage velocity, and 60 laser shots/spectrum hardware average. Reprinted with permission from Reference 30. Copyright 2011 Springer.
